OpenTelemetry Export
YipYap exports monitor metrics via the OpenTelemetry Protocol (OTLP) so you can visualize and analyze uptime data in your existing observability platform.
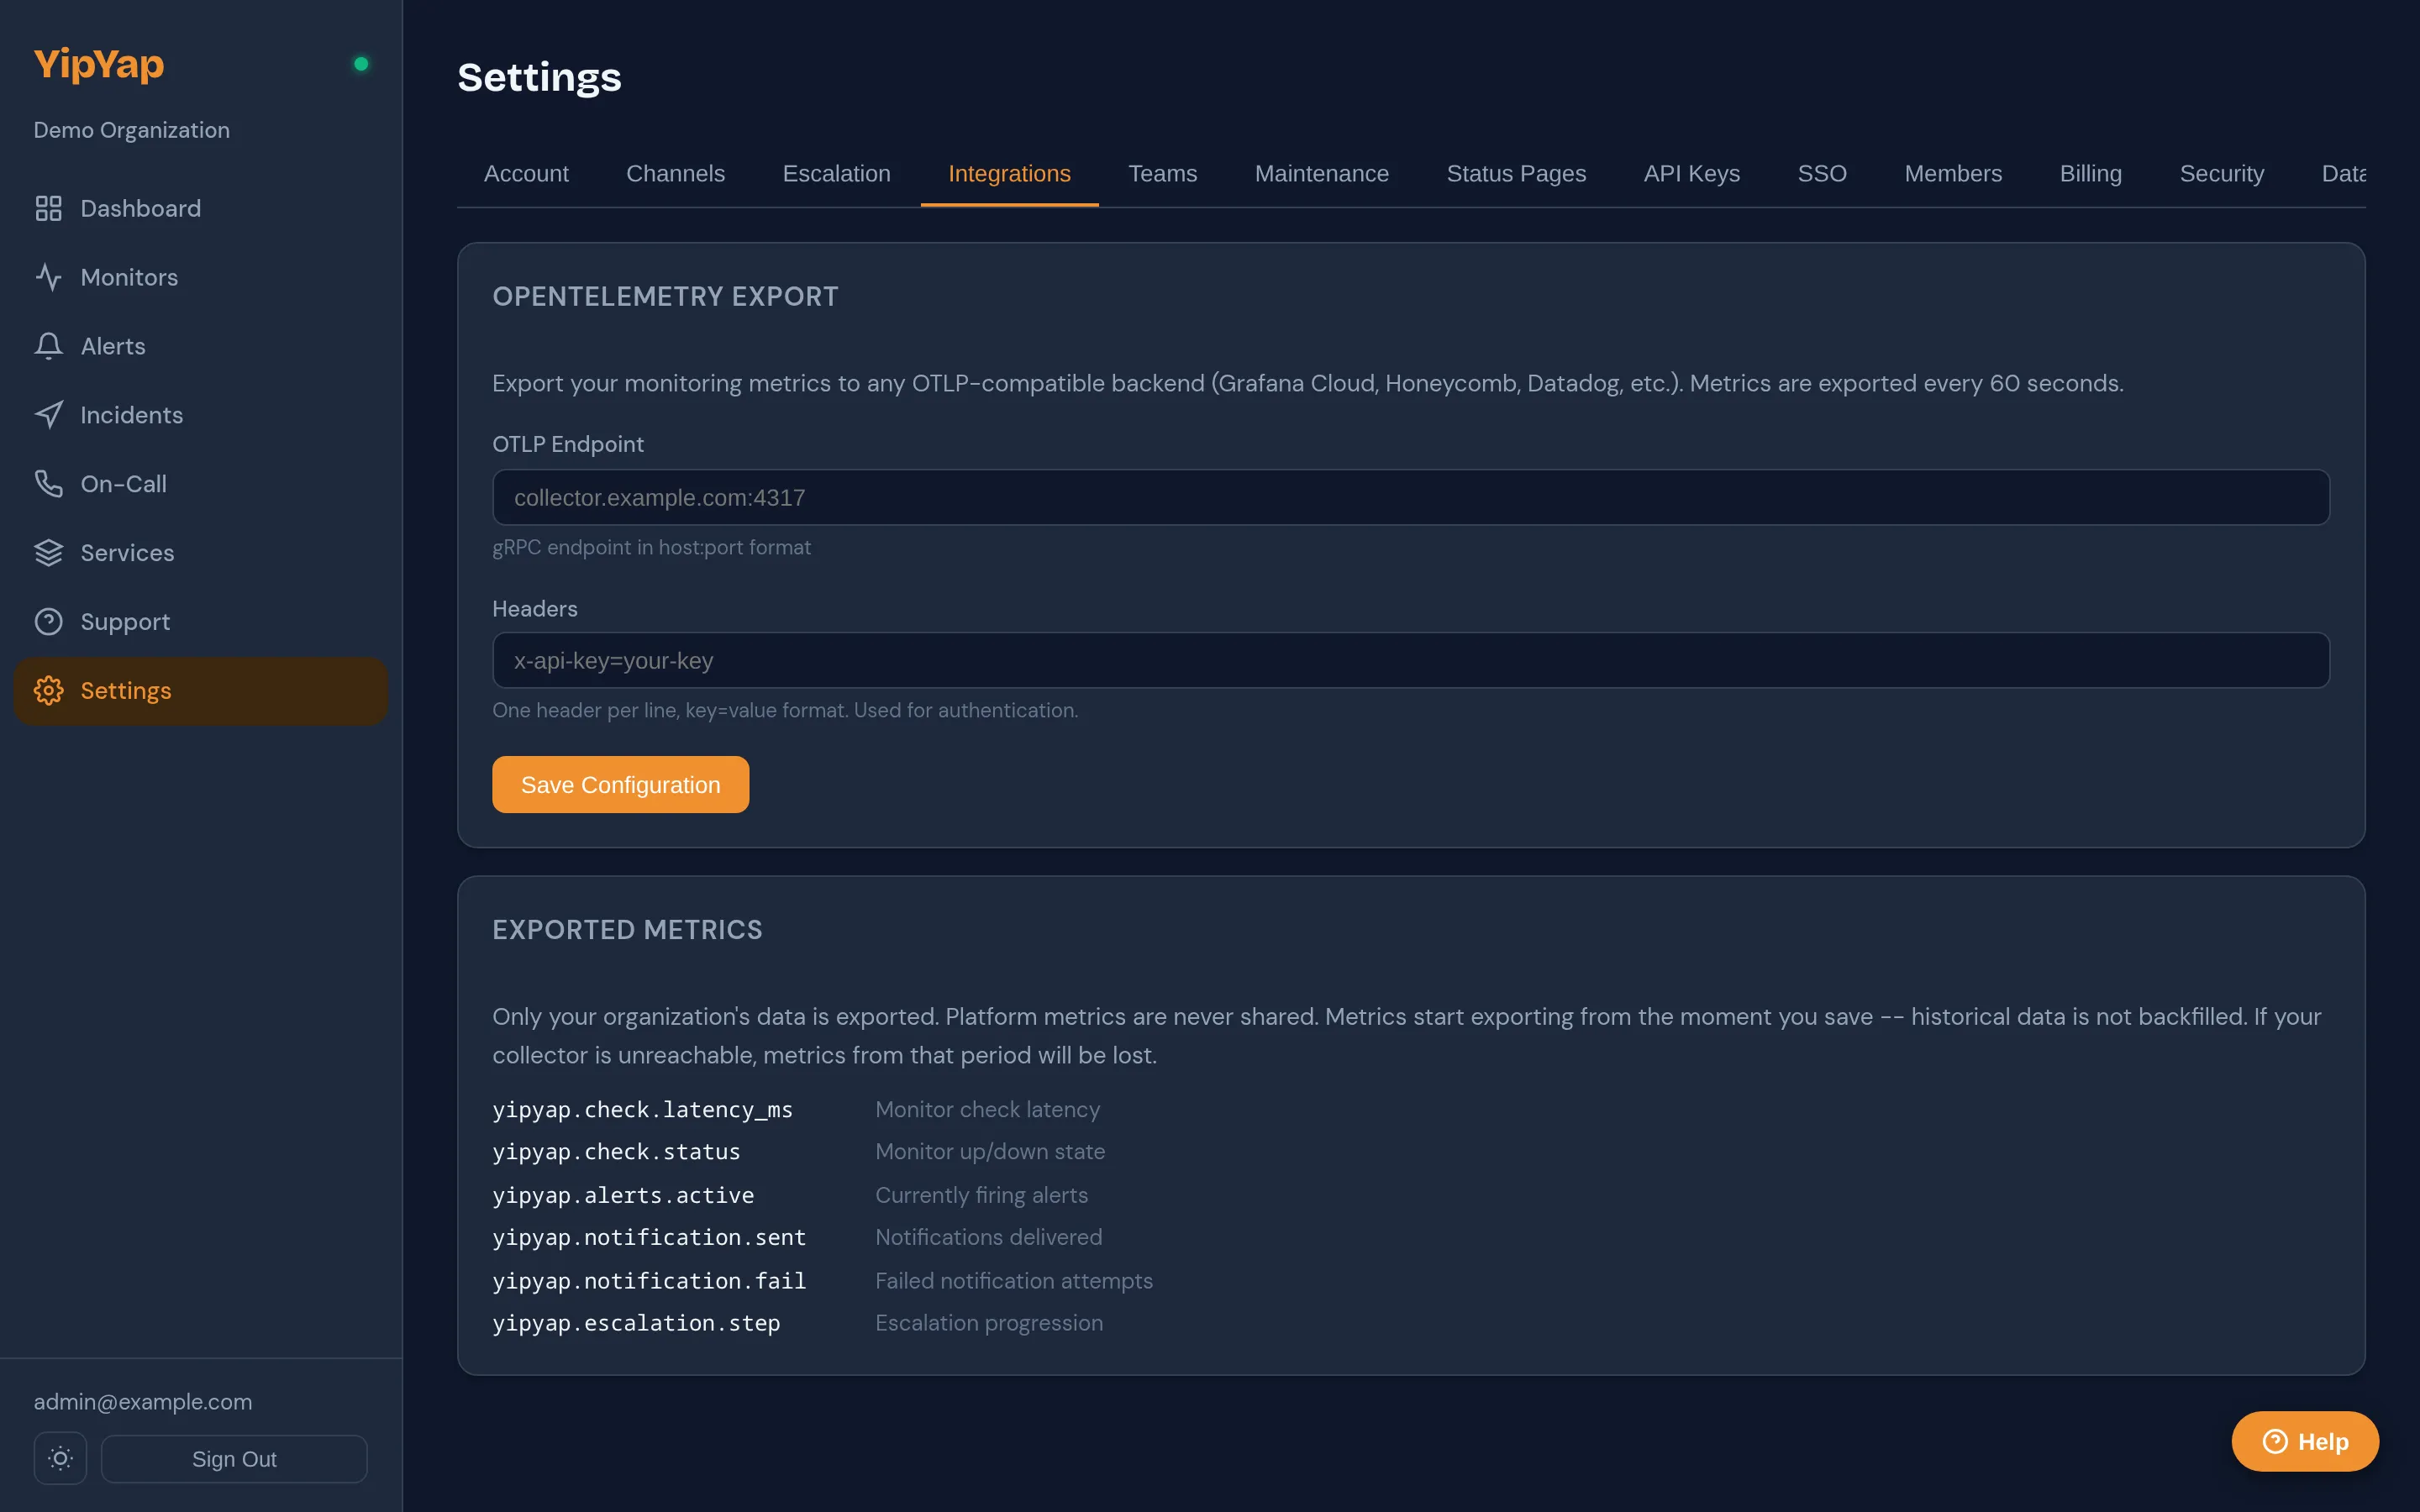
- Navigate to Settings > Integrations > OpenTelemetry.
- Enter your OTLP endpoint URL.
- Configure authentication headers (e.g. API key, bearer token).
- Click Save.
Export is configured per organization. Each org can have one OTLP destination.
Exported Metrics
Section titled “Exported Metrics”| Metric Name | Type | Description |
|---|---|---|
yipyap.monitor.status | Gauge | Current status (1=up, 0=down). |
yipyap.monitor.latency_ms | Gauge | Last check latency in milliseconds. |
yipyap.monitor.uptime_pct | Gauge | Rolling uptime percentage. |
yipyap.monitor.cert_days | Gauge | Days until TLS certificate expiry. |
yipyap.alert.count | Counter | Total alerts fired. |
All metrics include labels for monitor_id, monitor_name, and monitor_type.
Export Interval
Section titled “Export Interval”Metrics are exported every 60 seconds. This interval is not configurable. There is no backfill for periods when the export destination was unreachable; missed exports are skipped.
Provider Guides
Section titled “Provider Guides”Honeycomb
Section titled “Honeycomb”Endpoint: https://api.honeycomb.ioHeader: x-honeycomb-team = <your API key>Grafana Cloud
Section titled “Grafana Cloud”Endpoint: https://otlp-gateway-prod-us-east-0.grafana.net/otlpHeader: Authorization = Basic <base64(instanceID:token)>Datadog
Section titled “Datadog”Endpoint: https://otel.datadoghq.comHeader: DD-API-KEY = <your Datadog API key>ClickHouse
Section titled “ClickHouse”Use the ClickHouse OpenTelemetry collector as an intermediary. Point YipYap’s OTLP export at the collector’s gRPC or HTTP endpoint.
VictoriaMetrics
Section titled “VictoriaMetrics”Endpoint: https://<your-vm-instance>/opentelemetryVictoriaMetrics accepts OTLP data natively. See the VictoriaMetrics OTLP docs for details.