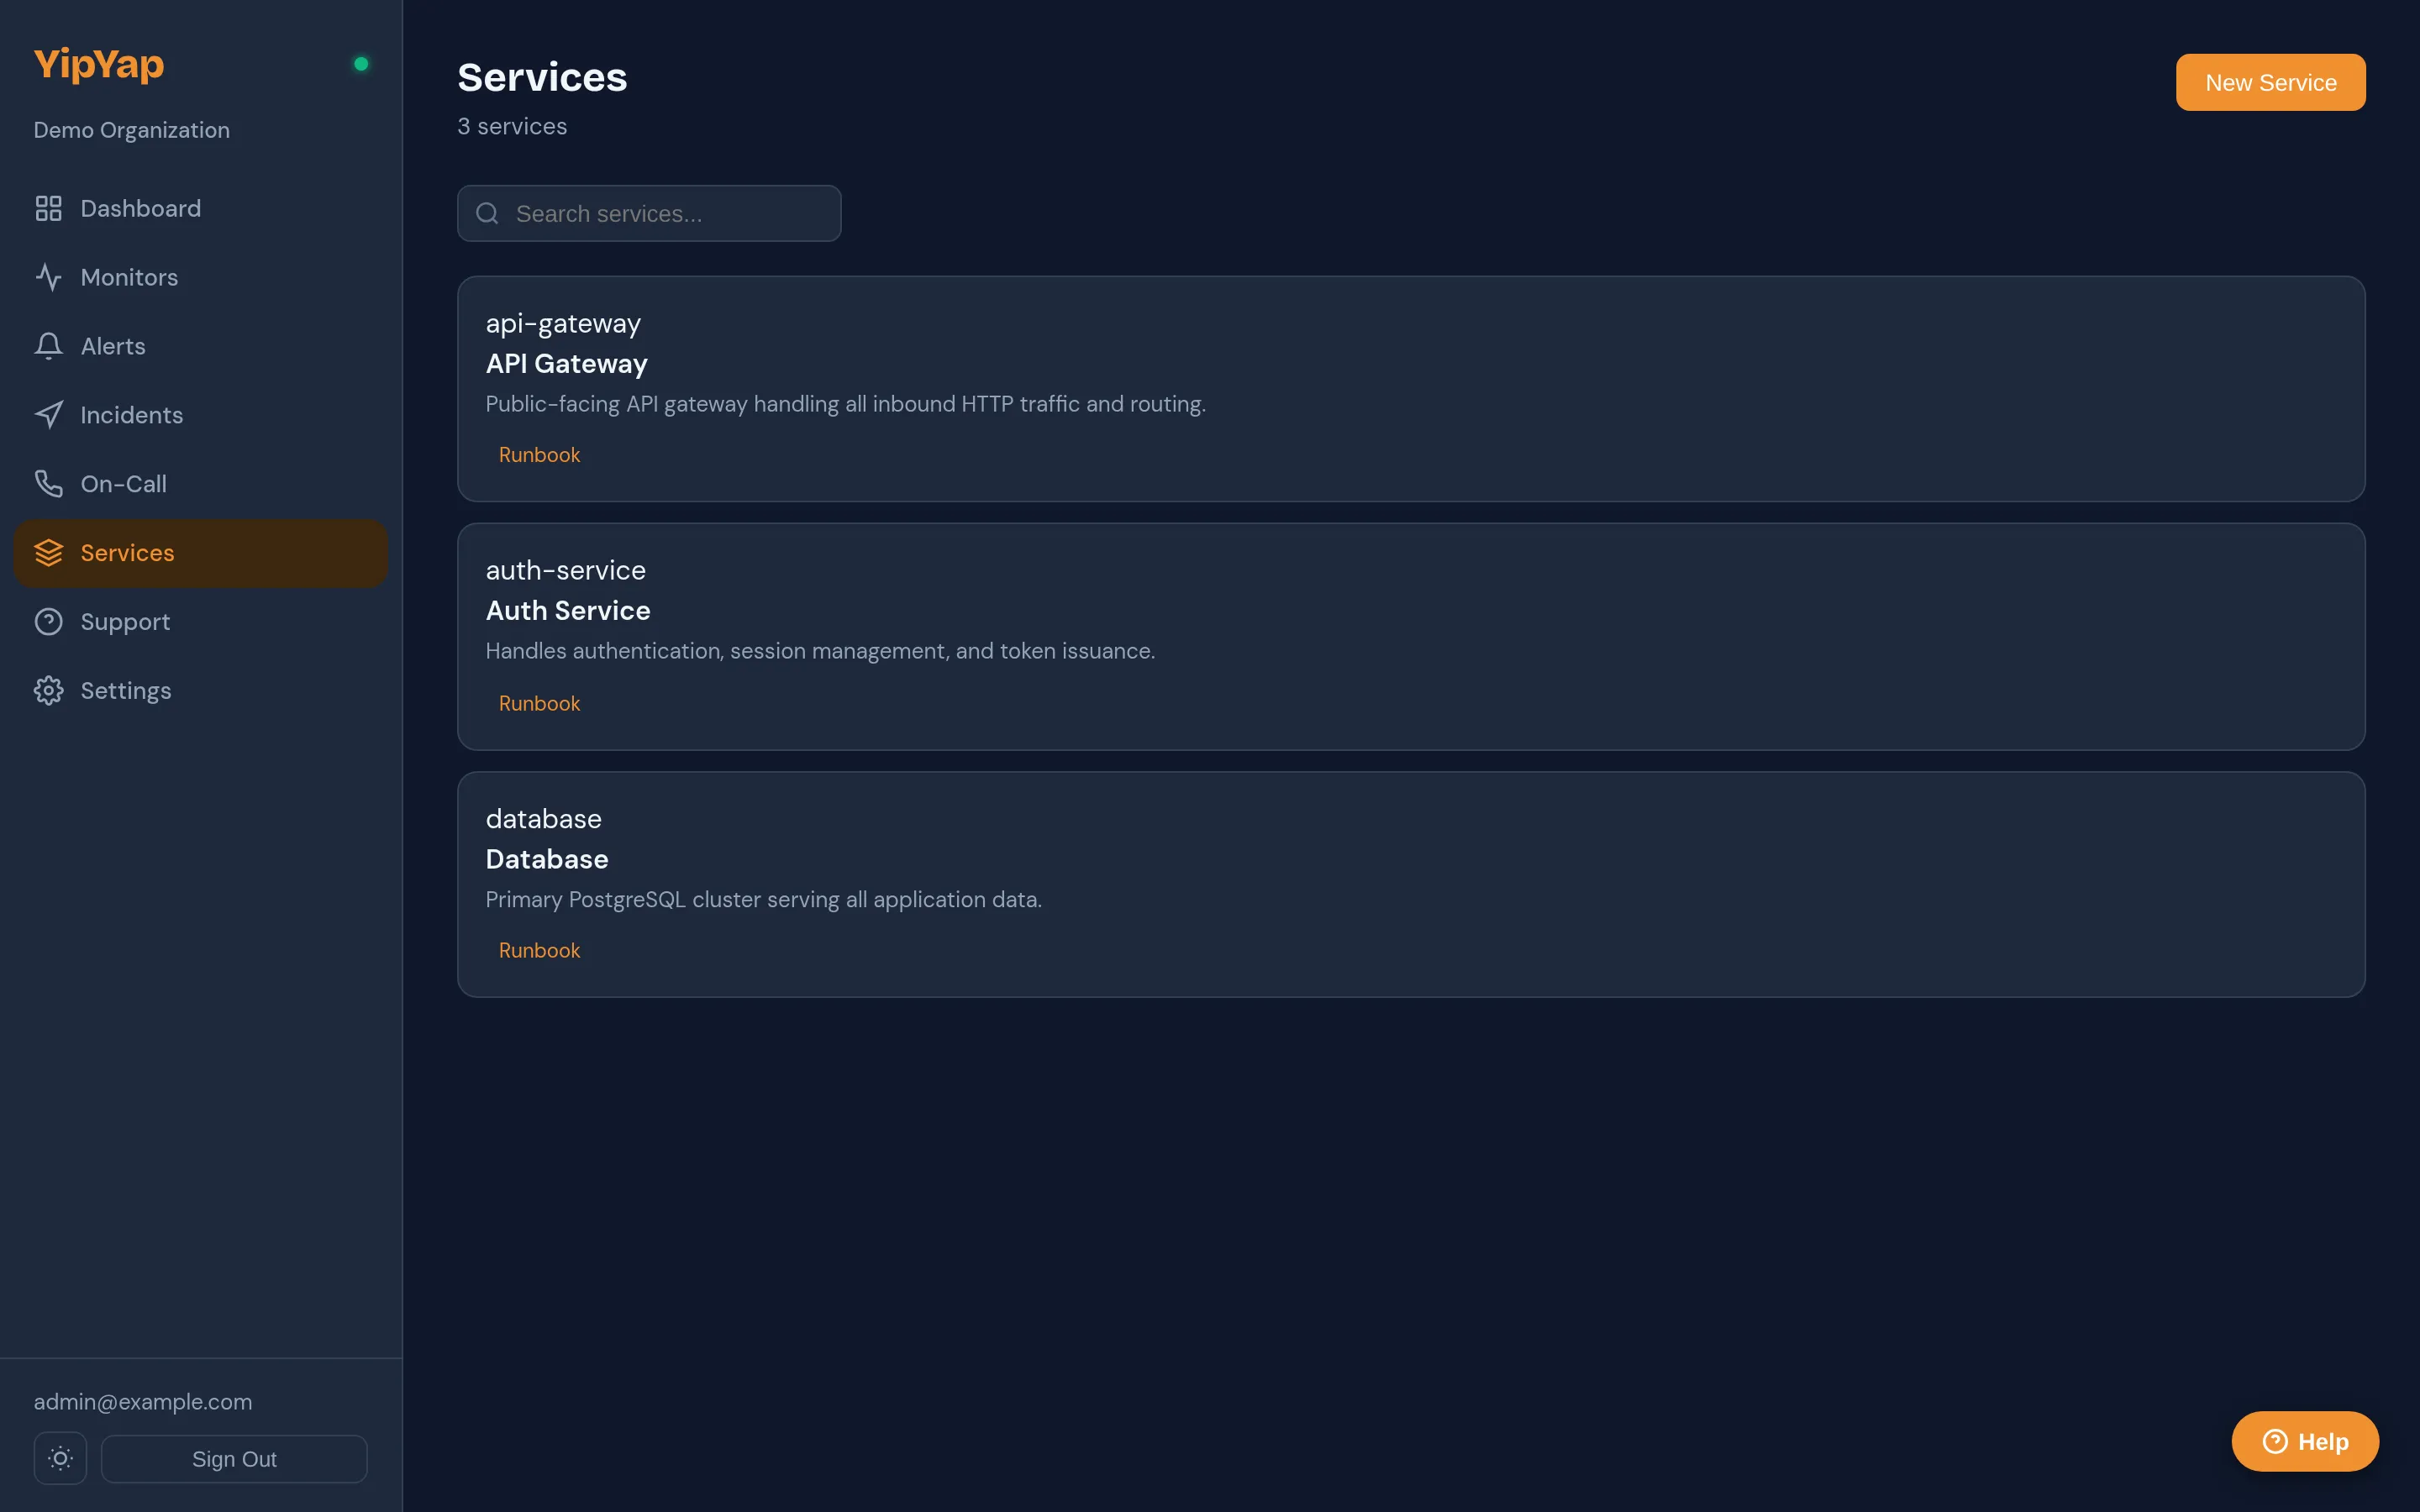
Service Catalog
The service catalog is YipYap’s internal-facing map of your system: a directory of services, each with its owners, monitors, runbooks, dashboards, and dependencies. When an alert fires for a monitor that’s been linked to a service, the alert surface picks up the service’s context (runbooks, links, owner team) automatically.
This is the difference between “Public API monitor is down” and “Public API (tier-1, owned by platform-oncall, runbook: rollback the latest deploy, depends on user-db and feature-flags).” On-call quality is the cumulative product of small contextual nudges; the catalog is the systemic version.
What’s in a service
Section titled “What’s in a service”A service has:
- Name: short, system-recognisable. (“checkout-api”, not “the checkout API service we built last quarter”.)
- Description: what the service does, in one or two sentences. Plain text, used in alert context.
- Tier:
tier-0(mission-critical),tier-1(production-customer-facing),tier-2(internal-but-important),tier-3(experimental). Drives default alert severity and affects status-page prominence (for teams that publish service tiers). - Owner team: references a Team. Used as a fallback escalation target when the monitor’s escalation policy hits a “team” step that doesn’t otherwise resolve.
- Linked monitors: the monitors whose health represents this service’s health. A service can have multiple monitors (HTTP + heartbeat + dependency-probe is typical for a real service).
- Links: runbooks, dashboards, repository, design docs. Each is
(label, url, kind). Surfaced both in the catalog UI AND on alert detail pages. - Dependencies: directed edges to other services. Used for blast-radius visualisation and for alert-context enrichment (“this alert affects 4 downstream services”).
- Labels (key/value): free-form tagging used for filtering and grouping.
What it’s not
Section titled “What it’s not”To set expectations correctly:
- Not a public-facing surface. Services don’t render on status pages. The catalog is a console-internal aid for operators. (Status pages display monitors, organised into operator-defined groups; they’re a curated public face, not a mirror of the service graph.)
- Not a monitoring substitute. The catalog doesn’t run health checks of its own; it derives a status badge from the linked monitors. If you don’t have monitors on a service, its catalog status will be “Unknown”.
- Not a service mesh. “Dependencies” are documentation, not runtime. Declaring
checkout depends on user-dbdoesn’t intercept network traffic or enforce policy. It enriches alerts and visualises blast radius; it doesn’t reroute requests. - Not a CMDB. It’s intentionally minimal: the goal is “context for on-call,” not “complete inventory of every running process.” Add what helps; resist the urge to add what doesn’t.
When to add a service
Section titled “When to add a service”A useful rule of thumb: if an operator paged at 03:00 would benefit from knowing it exists, add it; otherwise, skip.
Cataloguing every Lambda function and Kafka topic is a path to a directory that no one maintains. Cataloguing your top 10-20 customer-impact-relevant services with sharp names, real owners, and current runbooks pays back the first time an alert fires.
- Features → Service Catalog → New Service.
- Name + Description + Tier (default
tier-2). - Owner Team: pick from existing teams. (Settings → Teams to create one.)
- Linked Monitors: multi-select. The monitor’s current status drives the service’s status; the latest alert on each monitor surfaces in the service detail page.
- Links: add runbook URLs, repository URLs, dashboard URLs. Each link picks a
kind:runbook,dashboard,repo,docs,other. The kind drives which icon renders. - Dependencies: declare what this service depends on. The dependency graph enforces a DAG (no cycles); the UI surfaces a blast-radius preview when you save.
- Save.
Once saved, every alert from a linked monitor will carry the service’s name, tier, owner team, and the FIRST runbook link in its surface; the on-call sees this on every page.
Tiers and severity
Section titled “Tiers and severity”Tiers exist to make “this is mission-critical, that is experimental” legible at a glance. The mapping:
| Tier | Default downtime severity | Status page prominence | Default escalation behaviour |
|---|---|---|---|
tier-0 | Critical | Prominent | Page primary on-call immediately, fallback to manager team within 5 min. |
tier-1 | Major | Prominent | Page primary on-call, fallback within 10 min. |
tier-2 | Minor | Standard | Page primary on-call, fallback within 30 min. |
tier-3 | Info | Collapsed by default | Best-effort during business hours. |
The escalation behaviour is a default; your actual escalation policy on the linked monitor wins. The tier just sets a sensible starting point for new policies and a presentation hint for the catalog UI.
Runbooks
Section titled “Runbooks”A runbook link attached to a service shows up on every alert from a linked monitor. The convention is:
- Title is short and actionable: “Rollback the latest checkout deploy”, not “Checkout incident response procedures v3 (Q2 2025)”.
- URL points to wherever the runbook lives: Notion, Confluence, an internal wiki, GitHub markdown, doesn’t matter.
- Kind:
runbookfor actual playbooks;docsfor background reading;repofor source.
The first runbook-kind link on a service is highlighted in alert notifications; additional runbooks are listed below. If you have one runbook for a service, that’s plenty; if you have ten, the on-call won’t read any of them. Split them by symptom and link the most-likely-relevant one.
Dependency graph
Section titled “Dependency graph”Declared dependencies form a directed acyclic graph. The catalog UI shows:
- Upstream: services this service depends on. If checkout is down, look at user-db and feature-flags first.
- Downstream: services that depend on this one. If user-db is down, expect alerts from checkout, login, profile.
Cycles are rejected at create time: if you try to declare a circular dependency, the API returns 422.
Dependencies are documentation, not runtime; see What it’s not above. They don’t intercept traffic or enforce policy.
Relationship types
Section titled “Relationship types”When declaring a dependency:
| Relationship | Meaning |
|---|---|
required | Outage of the target degrades this service. Surfaced as “Critical dependency” in alert context. |
optional | Useful but not required; outage causes degradation only. |
informational | No health implication; just documenting the edge. |
The relationship type drives blast-radius visualisation (required edges propagate severity; informational ones don’t).
Labels
Section titled “Labels”Free-form string → string map. Common patterns:
lang: go,lang: rust,lang: typescript: language ownership.runtime: k8s,runtime: lambda,runtime: vm: deploy substrate.region: us-east-1,region: eu-west-1: locality.pii: high/pii: low: compliance scoping.
Labels can be filtered in the catalog list view and queried via the Services API. They’re metadata; they don’t drive behaviour by themselves, but they let you build queries that do.
Alert context enrichment
Section titled “Alert context enrichment”When an alert fires for a monitor linked to a service, the alert surface (web dashboard, Slack, email, the reply audit) carries:
- Service name, tier, owner team
- The service’s first
runbook-kind link (highlighted) - A direct link to the service detail page in the console
- Names of services that depend on this one (downstream blast radius preview)
This is automatic; there’s no per-monitor checkbox to opt in. Linking the monitor to the service is the opt-in.
API access
Section titled “API access”Programmatic management lives behind the Services API, useful for terraform-style infra-as-code or for keeping the catalog in sync with your deployment pipeline.
Operational tips
Section titled “Operational tips”- Start with your tier-0 and tier-1 services. Coverage of the long tail can come later. Five well-curated services beat fifty stale ones.
- Owner team is mandatory in spirit, even though optional in the API. A service without an owner is a service no one fixes.
- Keep runbooks short and current. A runbook from 2024 that no one’s verified in 2026 is worse than no runbook; it’ll send the on-call down a dead path.
- Don’t catalog what’s already in your monitors’ descriptions. If a monitor’s
descriptionfield already says “Public API: customer-facing checkout endpoint”, duplicating it on the linked service adds maintenance, not value. - Use dependencies sparingly. A graph with every plausible edge is unreadable. A graph with the 5-10 most important edges is the one people will actually read.
Related reference
Section titled “Related reference”- Services API: programmatic CRUD.
- Teams: owner-team management.
- Monitors: what gets linked.
- Alerting → Escalation Policies: how owner teams resolve at page time.